



Assessment of jump performance is routinely implemented in elite sporting environments to determine training priorities, monitor fatigue, identify injury risk factors and guide rehabilitation, and benchmark athletes against their competitors. The two most common tests are the ballistic, slow stretch shortening cycle (SSC; movement time >250 ms) countermovement jump (CMJ; movement times commonly 500-750 ms) and the reactive, fast SSC (ground contact time <250 ms) drop jump. Unfortunately, the testing procedures, calculation of metrics from force-time data (when using force plates) and selection of the metrics is rarely appropriately standardised, increasing the measurement error and reducing their utility 1 2 3. These issues increase the magnitude of change required to determine a meaningful change (i.e., the change observed needs to be greater than the measurement error for it to be meaningful). Such a lack of standardisation also means that comparisons between studies can be difficult as the differences can notably affect the values calculated from the force-time data 1 2. Even more of an issue is comparing changes in performances if different practitioners working with the same athletes have used different testing procedures. Simple aspects of testing procedures, such as cueing, can notably affect jump performance. For example, the cue to jump ‘as high as possible’ results in increased jump heights and longer movement times compared to the cue to ‘jump as fast as possible’, resulting in shorter movement times and lower jump heights (see example in Table 1).
Table 1. Comparison of different verbal cues on countermovement jump metrics
It is also important to note that for most jump testing arm swing should be eliminated, with the athlete keeping their hands on their hips. Arm swing can increase downward velocity and therefore momentum, increasing stimulation of the SSC, which may increase jump height. While the upward motion of the arms also increases the individual’s momentum during the propulsive phase, also increasing jump height 4 5. As such, increases in jump height can simply be due to improved coordination of the limbs rather than increased force production of the legs.
Countermovement jump
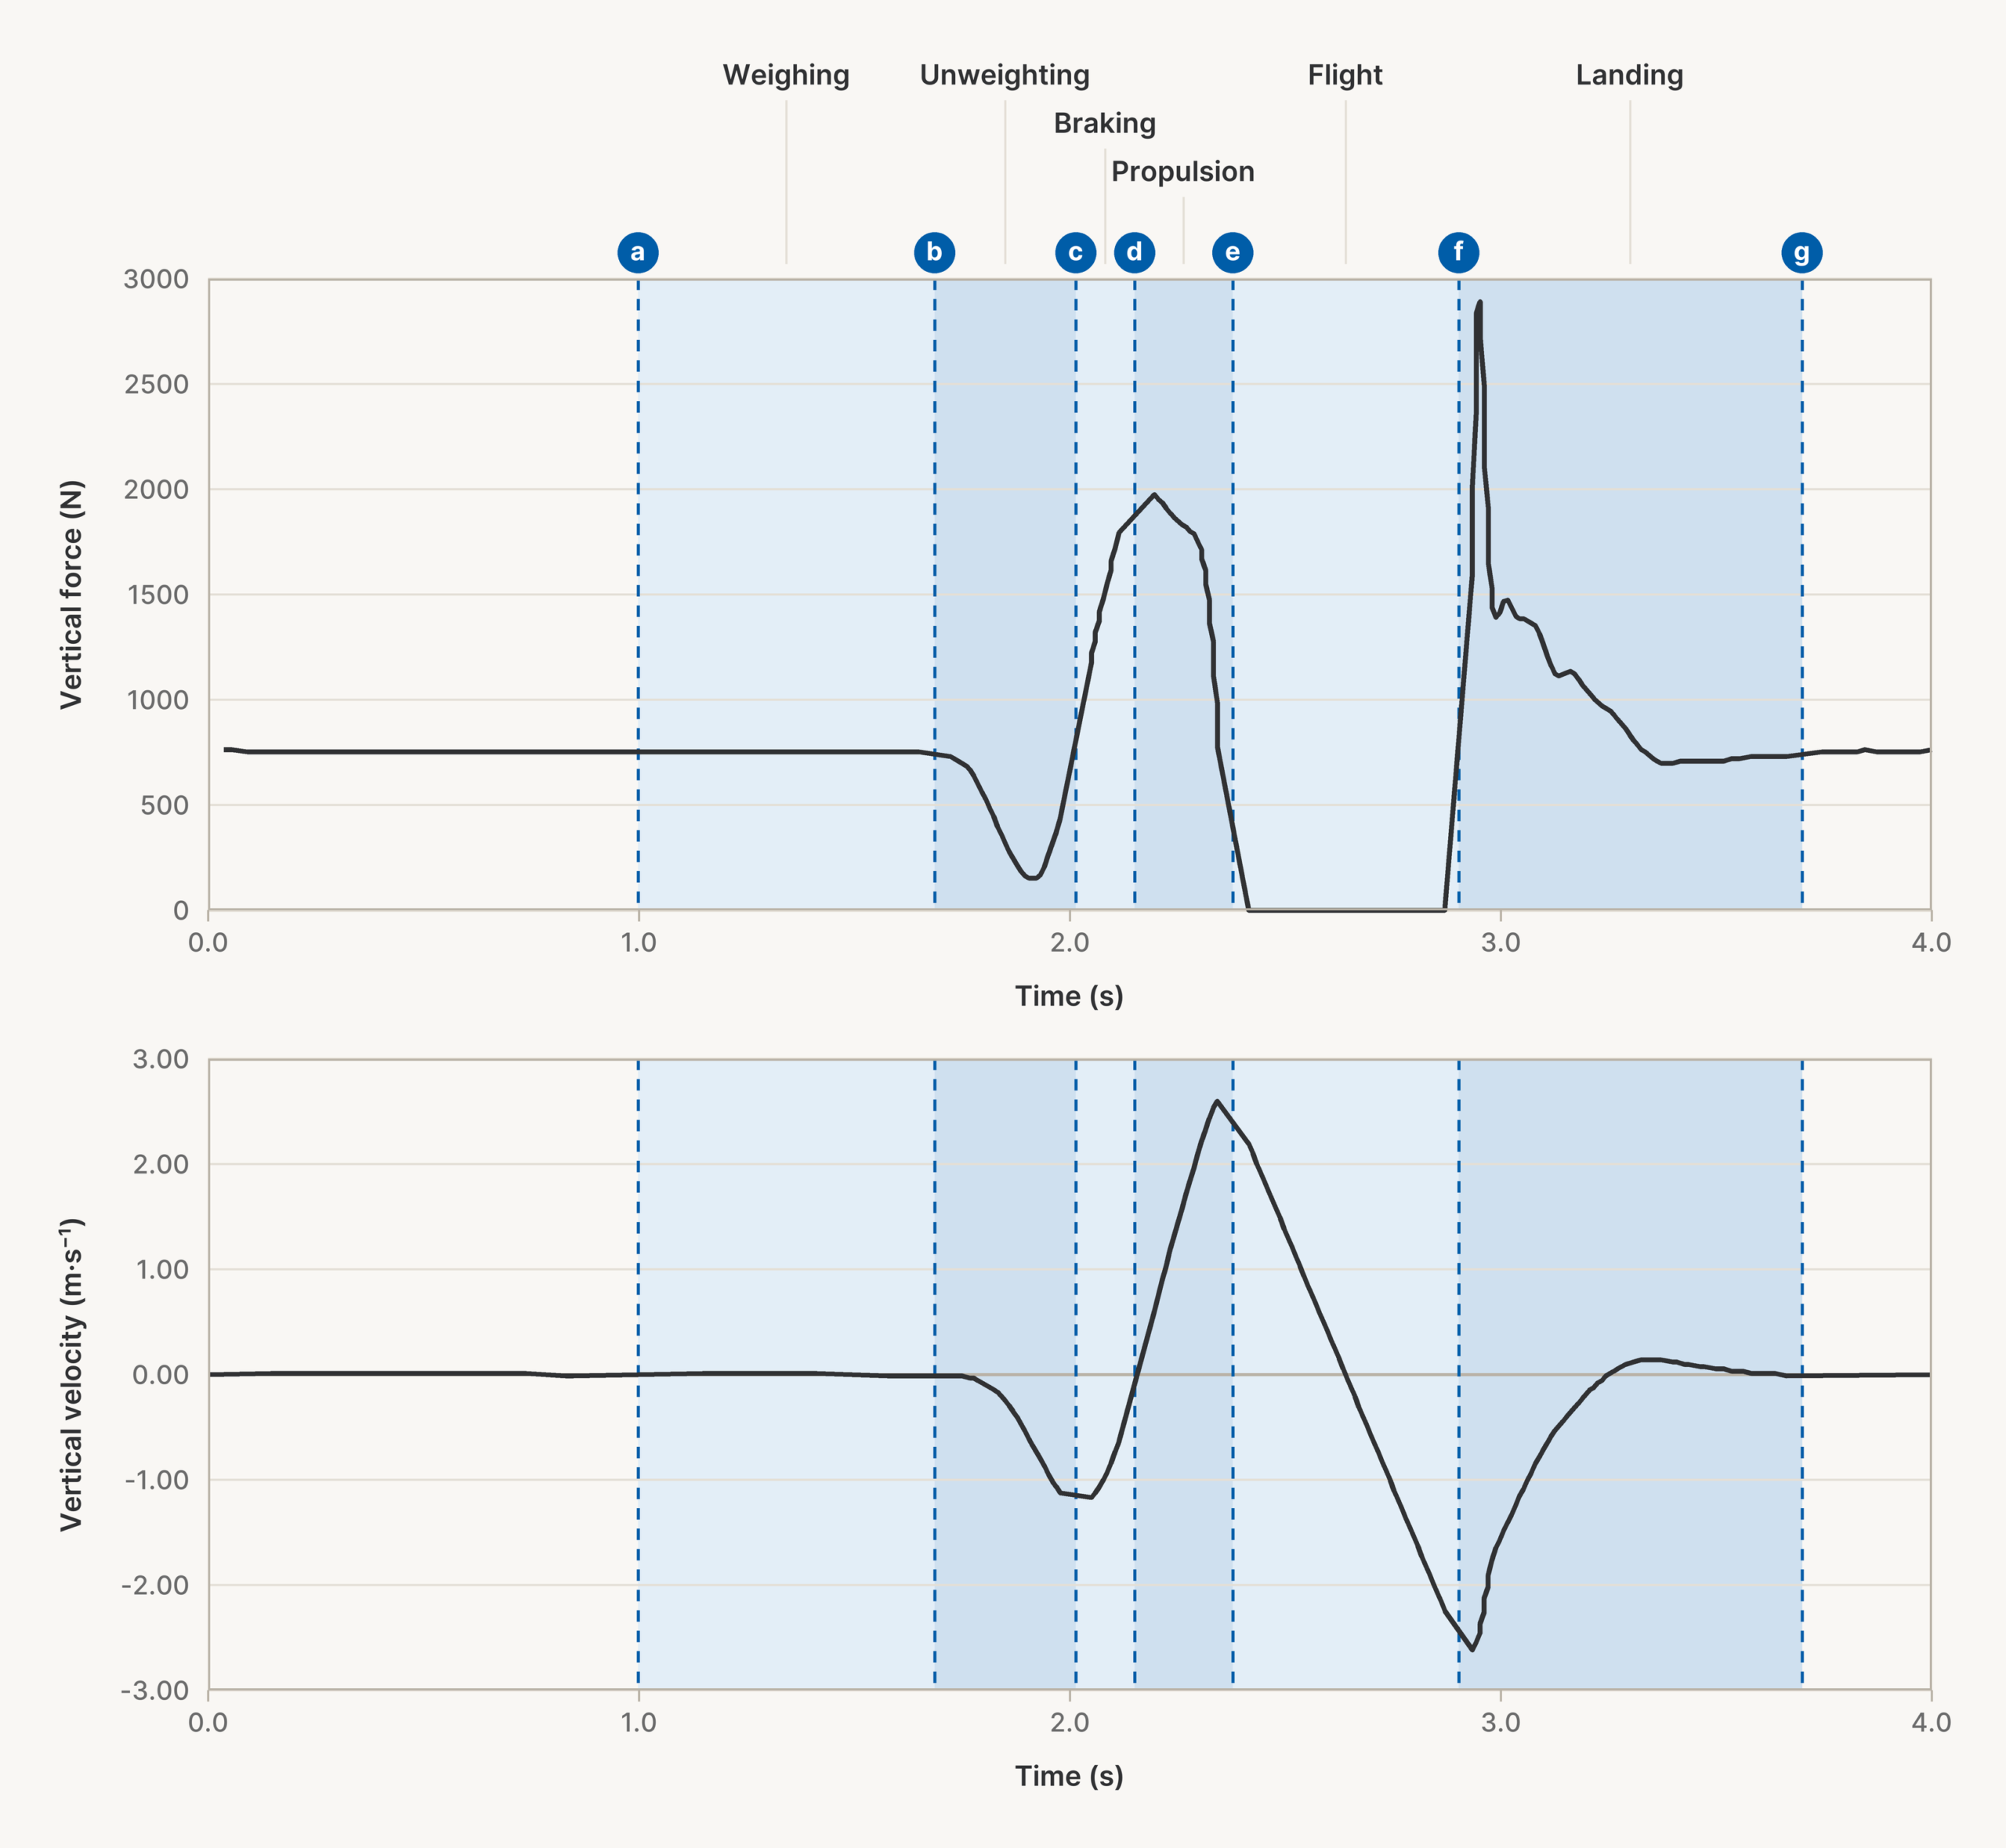
When assessed using force plates, the CMJ consists of a weighing phase, unweighting phase, braking phase, propulsion phase, flight phase and landing phase, although the first four phases are arguably the most important. Each phase should be identified by key events identified from either the force-time data or the velocity-time data (Figure 1), although displacement-time data can also be used. The unweighting phase is usually identified as an initial decrease in force (ideally, >5 standard deviations of the force during the one second weighing phase, minus 30 ms) 6. The unweighting phase ends and the braking phase starts at the point that the maximum negative vertical velocity is achieved and deceleration commences, which also corresponds to force returning to body weight 7 8. An object cannot start to decelerate until the force applied to it exceeds its weight. The end of the braking phase and the start of the propulsion phase commences when the negative velocity returns to zero and becomes positive, respectively 7. This corresponds to the lowest displacement of the individual’s centre of mass (i.e., lowest squat position). The propulsion phase ends and the flight phase starts when the force reduces to <5 standard deviations of the force during the flight phase (sometimes identified as an arbitrary threshold (e.g., <20 N) depending on the software used), signifying that the individual is no longer in contact with the force plate 1 2 7. The flight phase ends and the landing phase starts when the force exceeds 5 standard deviations of the force during the flight phase, also sometimes identified as an arbitrary threshold (e.g., >20 N) 1 2 7. The landing phase ends once the athlete has applied a net impulse equivalent to their net propulsive impulse, based on the impulse momentum theory 7.
Even when all testing procedures and data analysis methods are standardised appropriately, rarely do practitioners agree on which are the most appropriate metrics to evaluate. The confusion regarding metric selection is likely due to the volume of available metrics (e.g., >100 for a CMJ alone) which are now instantaneously calculated in the software of most commercial force plate manufacturers, and the varying range of metrics reported in the published literature. This is compounded by a lack of formal biomechanical education of many force plate users and the duplication of some metrics in these commercial force plate systems. For example, time to take-off and movement time are the same, calculated from the point at which the athlete commences the countermovement until they leave the force plate, although the thresholds used to determine these events can vary 1 2 3, especially between different commercial software packages. In contrast, other metrics, such as rate of velocity development should not be used as it already has a correct biomechanical term, in this case acceleration, and therefore rate of velocity development is not only redundant but nonsensical to use.
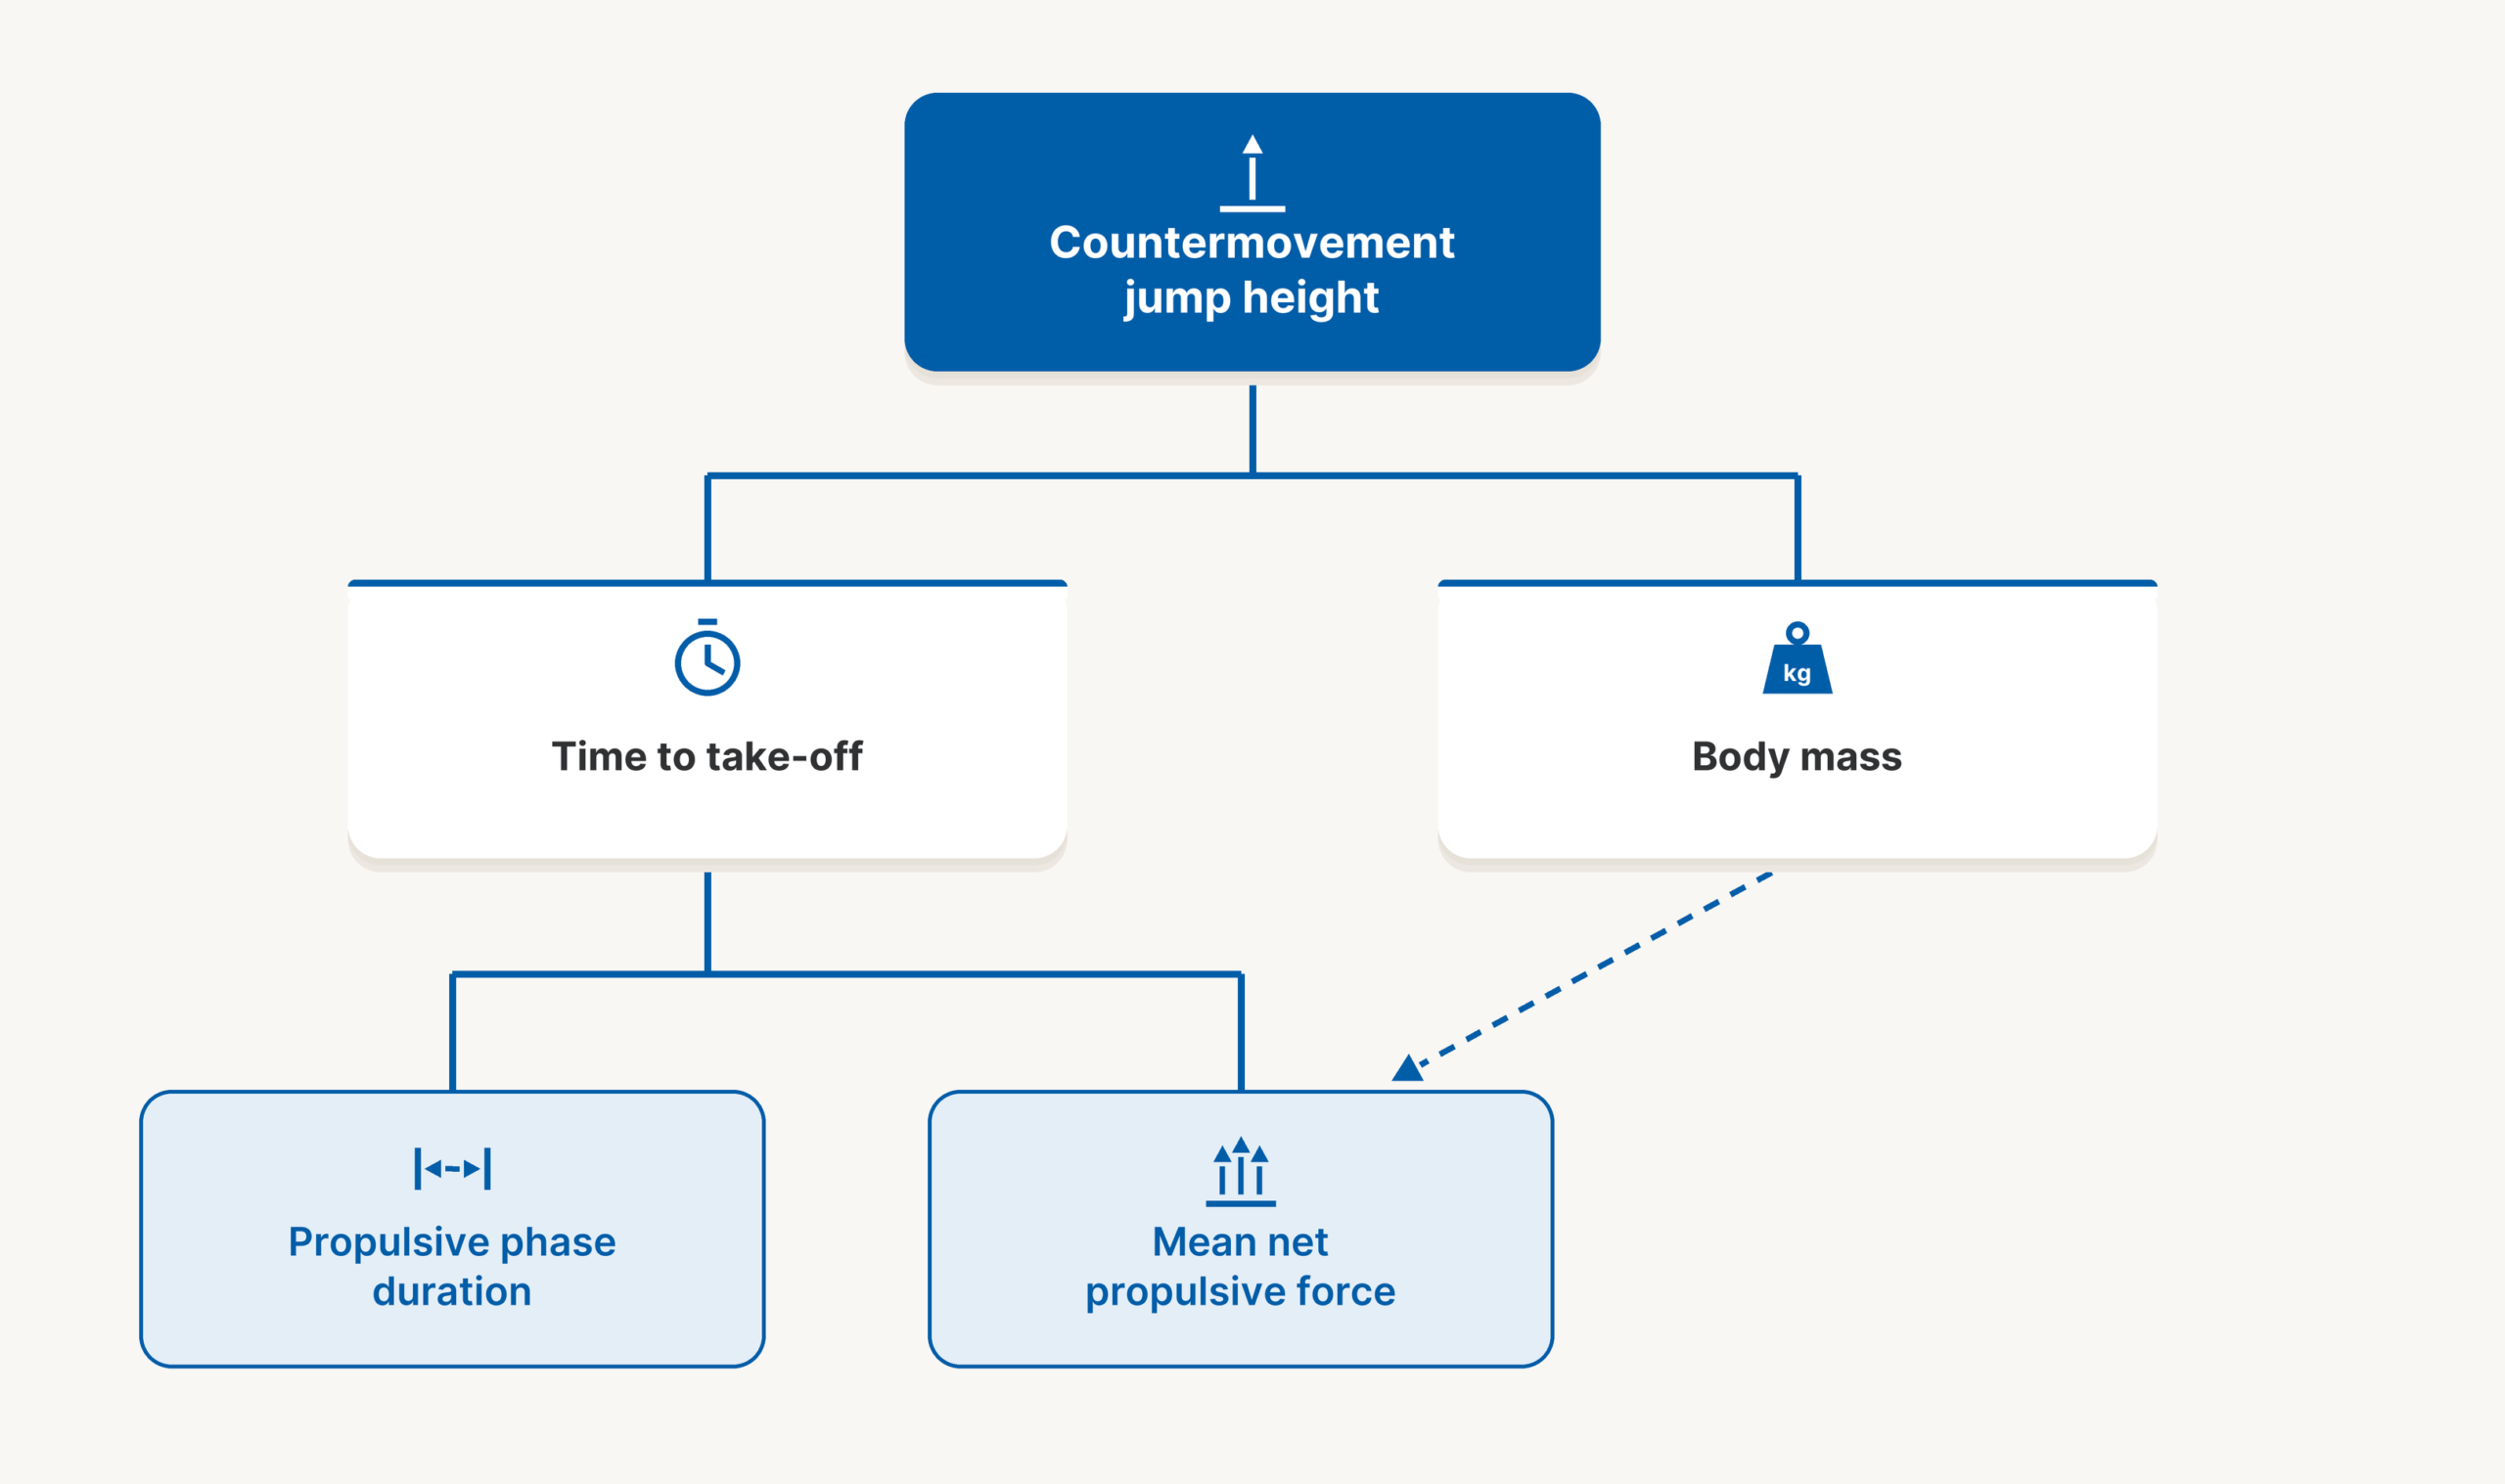
Which metrics? The most logical approach to selecting appropriate metrics for any jump assessment is to reflect on the underpinning biomechanics of what determines jump performance. Clearly, the key performance metric in any jumping task is jump height, but we need to understand how this is achieved. Jump height is determined by the velocity of the individual’s centre of mass at take-off. Take-off velocity is determined by the net impulse (i.e., force × time) produced during the propulsive phase, divided by the athlete’s mass, referred to as the relative net propulsive impulse 9 10 11. As such, this illustrates that jump height alone does not provide all the information that we need to determine if the athlete’s performance has meaningfully changed, or if the athlete is fatigued. A simple change in body mass can notably affect jump performance; so, if monitoring jump performance post competition, to identify if the athlete is fatigued, it is imperative to consider any changes in body mass, which may mask fatigue as a reduced body mass requires a lower propulsive net impulse to achieve the same take-off velocity 12. Additionally, even when body mass has not changed, the same propulsive impulse can be achieved with a reduced mean net propulsive force, and an increased propulsive phase duration, which is commonly achieved via an increased countermovement depth. The increased countermovement depth provides the individual with a greater displacement and usually duration for acceleration during the propulsive phase. As such, in addition to jump height, it is important to also consider the components of the relative net propulsive impulse and how they may have changed in response to training or competition.
To keep things simple, it may be easiest to consider both jump height and time to take-off, as a greater countermovement depth commonly, but not always, results in an increased time to take-off. However, as time to take-off includes the unweighting, braking and propulsive phases, a change in time to take-off alone may not always explain the change in jump performance, unless we consider the components of relative net propulsive impulse (i.e., body mass, propulsion phase duration and mean net propulsive force). This means we need to consider the following metrics (Figure 2):
- Jump height
- Time to take-off
- Body mass
- Mean net propulsive force
- Propulsion phase duration
In addition to these metrics, it may also be insightful to know if the countermovement depth has altered, likely altering the duration of the propulsive phase. While the above metrics focus on the propulsive phase, some practitioners may also want to gain insight into how the entire movement has been performed or how this may have changed in response to training (i.e., chronic adaptation), competition (i.e., fatigue) and injury rehabilitation. As such, it is important to understand how each phase may affect the subsequent phase.
During the unweighting phase (i.e., initial start of the descent, prior to the commencement of the braking phase), the velocity of the downward motion will directly affect the demands during the braking phase, based on the impulse momentum relationship. The higher the velocity during the braking phase, the greater the individual’s momentum (momentum = mass × velocity). To completely decelerate and come to a stop at the bottom of the countermovement (i.e., end of the braking phase) the braking impulse generated must equal the individual’s momentum during the unweighting phase. A more efficient impulse would be achieved over a short duration, resulting in a higher mean force over a short duration, which has been shown to occur naturally via an increase in lower body strength 13 14 15 16.
It is important to note that a higher velocity during the unweighting phase has the potential to increase jump height, via enhanced stimulation of the SSC, as the muscle spindles detect both the magnitude and rate of change in length of the musculotendinous unit. However, a greater jump height will only be achieved if the individual has the capacity to generate sufficient force, at the appropriate rate, to efficiently produce the required braking impulse to decelerate. The greater stimulation of the SSC should increase stored elastic energy in the connective tissues, increase high threshold motor unit recruitment and synchronise motor unit recruitment, each increasing the magnitude and rate of force production during the propulsive phase.
Interestingly, a higher mean force during the braking phase results in a higher force at zero velocity (the transition from the braking to the propulsion phase), resulting in a higher net force at the start of the propulsion phase. This higher net force at the start of the propulsion phase potentially increases the net impulse during the propulsion phase, thereby increasing jump height.
While ratio metrics such as modified reactive strength index (RSImod) have become increasingly popular, there are issues associated with any ratio metric used. RSImod is the individual’s jump height (reported in metres) divided by the time to take-off (reported in seconds), with RSI usually reported as arbitrary units (AU) to avoid confusion if reported as m·s⁻¹, as this is the unit for reporting velocity. This is not the main issue with RSImod and ratio metrics; the problem is that the same ratio can be achieved with different component parts and a higher ratio value does not always mean a better performance (Table 2). For example, if we look at the athletes in Table 2, based on RSImod athletes 3 and 4 are comparable (RSImod = 0.67), but athlete 4 has a 20 cm higher vertical jump, albeit with a notably longer (an additional 300 ms) time to take-off. As such, if we are focussing on the athlete’s ability to jump as high as possible, athlete 4 is the best of the four athletes; however, the time to take-off indicates that they need to focus on expressing force more rapidly. In contrast, athlete 3 is expressing force rapidly; however, the force is not sufficient within the short movement duration to result in a high enough net impulse to result in a higher jump height.
Table 2. RSImod, jump height and time to take-off in four athletes
Similar comparisons can be made between athletes 1 and 2, who have the same jump height, but notably different RSImod values, due to the notable differences in time to take-off, resulting in the conclusion that athlete 2 is better able to rapidly produce force during a slow SSC ballistic task (i.e., the CMJ). Based on this, it is recommended that practitioners consider the differences in jump height and time to take-off between athletes, to ensure a simple and clear picture of how they achieve their jump performances, making RSImod redundant.
Drop jump
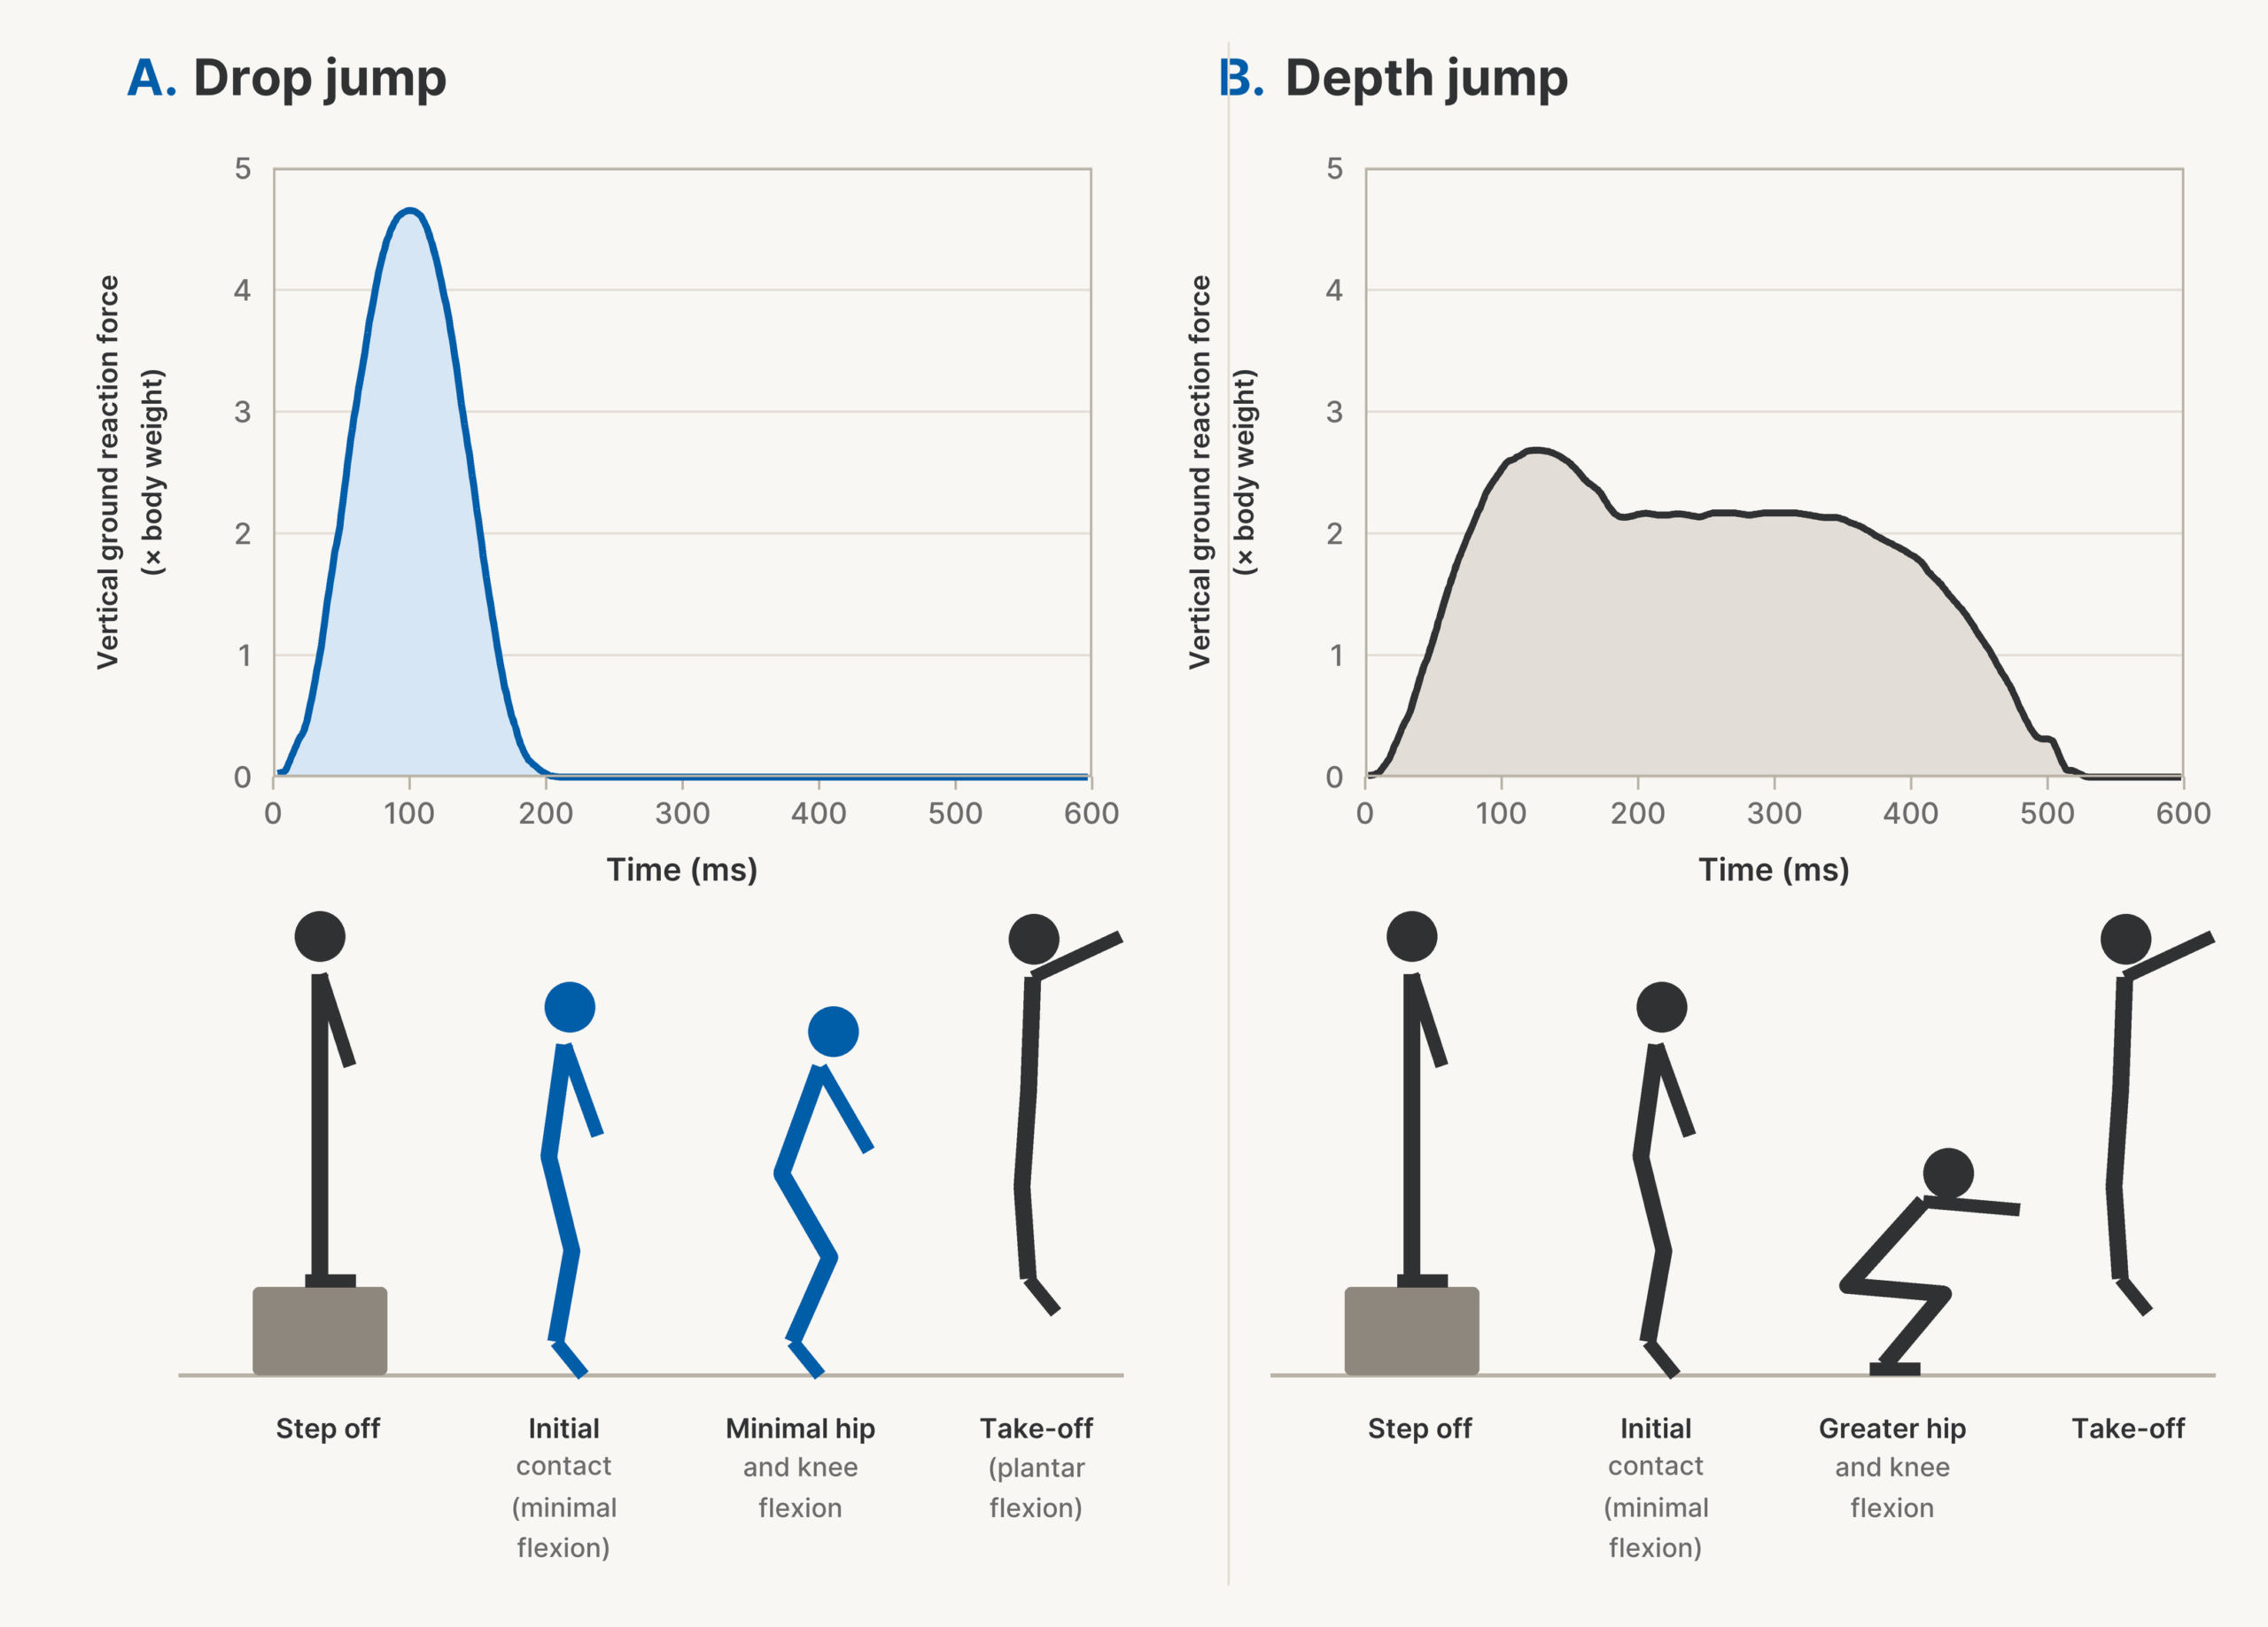
The drop jump incorporates an athlete falling off a box (not stepping and lowering their centre of mass) of a set height, landing with the ankles plantarflexed, with minimal flexion at the knees and hips (this is an ankle dominant task) and rapidly rebounding (<250 ms) from the ground to perform a jump (Figure 3A). This contrasts with the depth jump, which is a ballistic task, and does not utilise the fast SSC, due to greater flexion at the hips and knees resulting in a more prolonged ground contact time, as illustrated in Figure 3B.
The drop jump is arguably a little more complex, in terms of the analysis of the force-time data, compared to the CMJ. The assumption that is commonly made is that the individual falls from the exact height of the box that they are dropping off. However, numerous researchers have demonstrated that the box height and fall height are rarely the same, with fall height varying ±20% of the box height 17 18 19 20. For context, that means that if the box is 40 cm high, the fall height could vary between 32-48 cm (see Table 3). This can depend on whether the individual is confident and jumps off the box, thereby increasing the height of their centre of mass, or is less confident (common in injured athletes and those not familiar with the task) and steps down lowering their centre of mass. Ideally, fall height should be accounted for rather than the box height, to ensure that comparisons between athletes, studies or over time are fair, as a change in fall height will alter the velocity at which the athlete contacts the ground 19. Any differences in velocity will therefore alter the athlete’s momentum, changing the impulse required to decelerate them prior to the commencement of the propulsive phase, based on the impulse momentum relationship.
Table 3. The effect of changing fall height on centre of mass velocity and momentum upon ground contact, during a drop jump
Currently, no-one has provided a definitive threshold of an acceptable difference between box height and fall height. However, to keep things simple and reduce the variability from the observed 20% 17 18 19 20, a threshold of 10% or ideally 5% may be ideal, as there will always be some variability in strategy and in applied settings there is limited time to evaluate athletes, especially if performing multiple tests. It would also be advantageous to evaluate the drop jump using a range of box heights (e.g., 20, 40 and 60 cm), so that as the athlete develops, they are still challenged by the test, but also so that less well-trained athletes do not find the task too challenging. As athletes develop and exhibit very short ground contact times and higher jump heights from the lower box, there is little room for improvement, due to the fact that the time available to produce a propulsive impulse becomes so low. This is why it is essential to evaluate performance across a range of box heights. For longitudinal assessments, progressing to a higher box, which the athlete has not previously used, does not permit a longitudinal comparison, as it is not appropriate to compare the performances from one box height to those from a different box height, due to the differences in the braking demands.
Another important point to consider is that the drop jump should be used to evaluate reactive strength and fast SSC function, and as such there should be a maximal ground contact time threshold of <250 ms, for a trial to be considered acceptable. This is commonly overlooked, with ground contact times in numerous published studies exceeding 250 ms (this should be referred to as a depth jump, which includes a greater angular displacement of the hips and knees compared to a drop jump) and therefore not evaluating fast SSC function and reactive strength but actually evaluating slow SSC function (see Figure 3). When observing drop jump performances there should be minimal flexion of the hips and knees upon landing, with the task being very ankle dominant, in notable contrast to the CMJ or a depth jump.
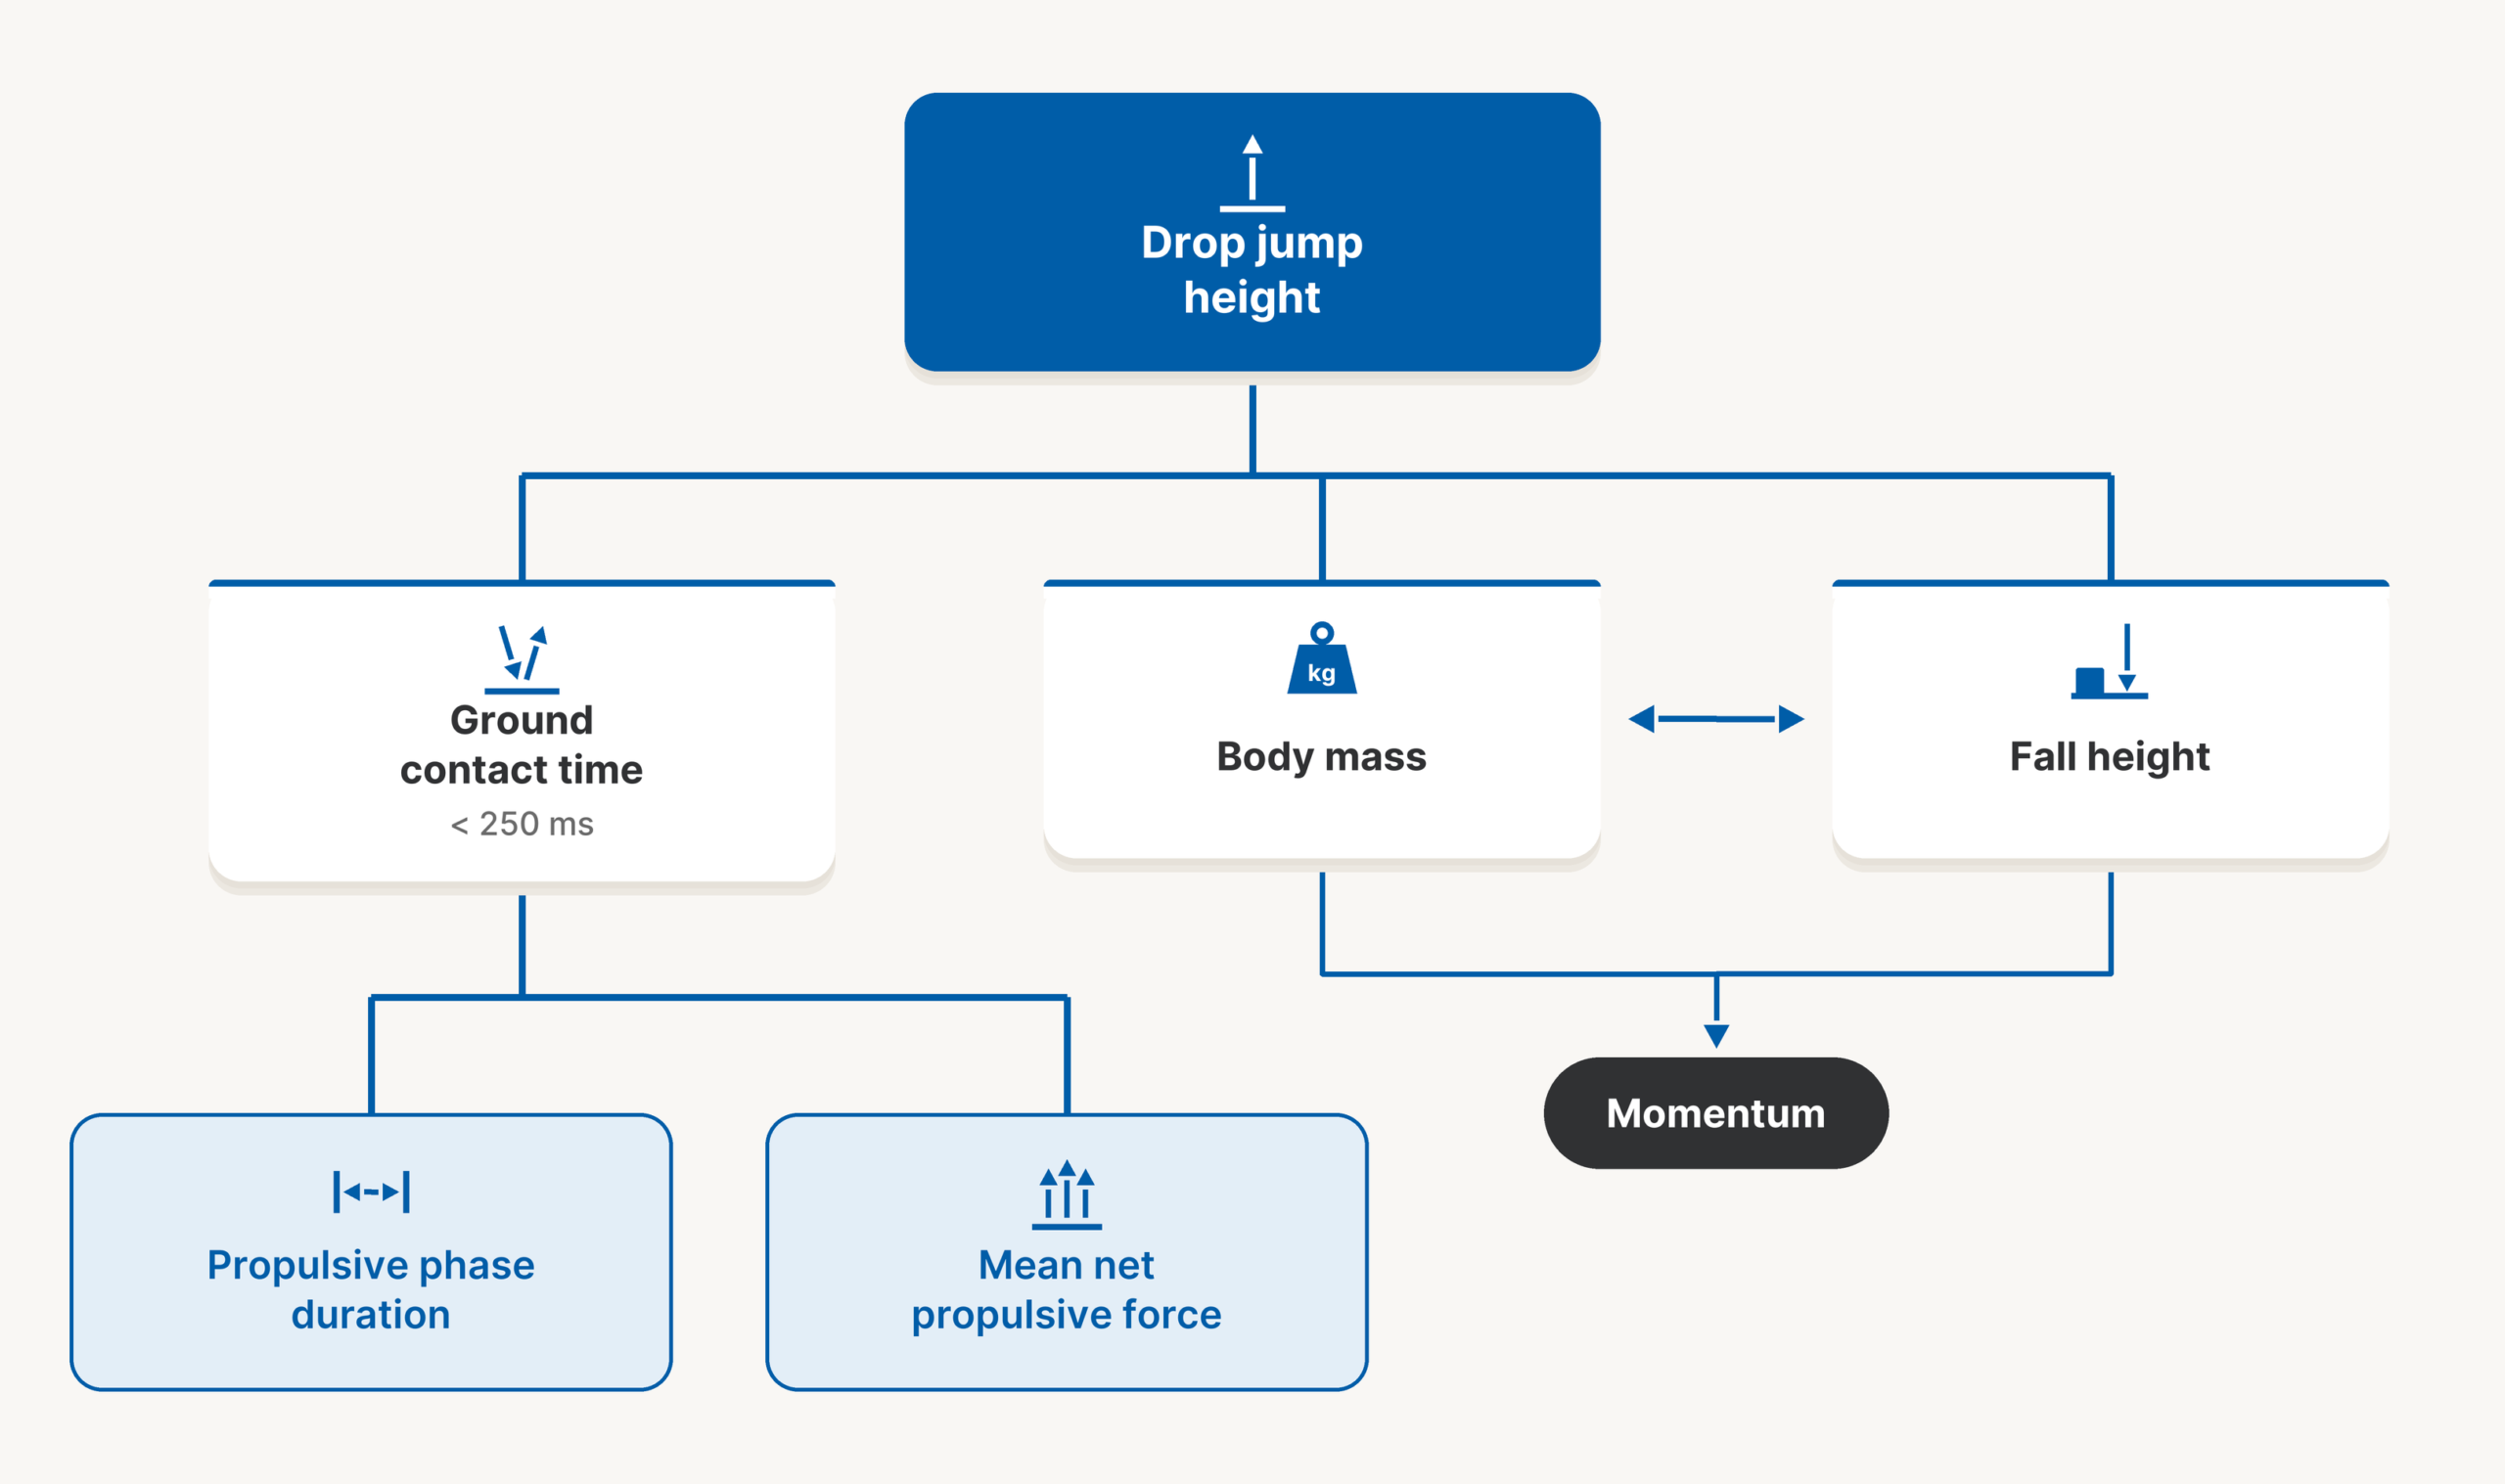
Which metrics? In terms of the metrics to evaluate, the most reported is reactive strength index (RSI); however, as with RSImod (Table 2), this should never be reported in isolation as it is the ratio between jump height and ground contact time, which should both be reported alongside RSI. This is important, as with any ratio metric, because the same RSI score can be made up of multiple combinations of jump height and ground contact time, and without the constituent parts, this could be misleading to the practitioner, coach or athlete 21. As such, simply focussing on jump height and ground contact time, while considering if the athlete fell from the height of the box, should be sufficient to permit a holistic view of their drop jump performance (Figure 4). If monitoring over time, it is also important to consider any changes in the athlete’s mass, as this combined with the fall height will notably alter the demands of the braking and propulsion phases. For a deeper understanding, knowing the components of propulsive impulse may also provide greater insight into how the rebound jump height was achieved (Figure 4).
Limb symmetry
Limb symmetry is something which practitioners commonly obsess over, wanting to ensure not more than a 10% or 15% difference between limbs. However, some athletes will inherently be asymmetrical due to the demands of the sport (e.g., athletes who run track, due to the demands of the bend, long jump athletes etc.). We also need to consider that irrespective of the method of calculating asymmetry 22, it is also a ratio (performance of one leg in relation to performance of the other leg) and that the same ratio can occur with notably different levels of performance. For example, an athlete could be perfectly symmetrical, but the limbs are weak, or symmetrical and strong, with the latter resulting in a lower injury risk. With this in mind, if the strong athlete is 50% stronger than the weak athlete, but they have a 16% asymmetry, are they at an elevated risk of injury, as both limbs are stronger than the weak athlete? Bishop et al. 22 have also illustrated how the method used to calculate asymmetry can impact the associated value, and as such it is important to be consistent with the calculation method and ensure that if comparing an individual’s data to published data, the methods are consistent.
We then also need to consider which force-time metric(s) we consider when evaluating asymmetry, and what to do if the magnitude or direction of asymmetry changes across metrics or testing methods, as has been reported in the literature 23 24. For example, during the CMJ the net propulsive impulse could be symmetrical, but the propulsion phase duration could be longer for one leg and the mean net propulsive force higher for the other leg. How would we interpret this, as this would mean that based on net propulsive impulse the jump would be symmetrical, but the asymmetry would change sides depending on whether we considered the duration or the mean net force? It is also worth noting that Lake et al. 25 reported that peak and mean forces demonstrated limited agreement in asymmetries during both the braking and propulsive phases of a CMJ. As such, they suggested that mean and peak values should not be used interchangeably and that different phases of the jump should also be considered separately.
As such, it would be better to determine thresholds or recommended target values for the durations and forces (ideally expressed relative to body mass, so that these are comparable and achievable for individuals of different statures) and consider these values first. Then to consider if there are notable asymmetries that we do not expect. For example, for a long jump or high jump athlete we would expect their ‘jumping leg’ to outperform the non-jumping leg.
Performance versus rehabilitation
Many practitioners will look at different metrics when evaluating athletes to inform training to enhance performance, or to monitor progress during rehabilitation. However, from a biomechanical standpoint this does not make sense, as we need to have a holistic view in both scenarios. Initially, we need to determine how the athlete is performing in comparison to their previous performances, for example, how high they are jumping during each task. If there is a deficit, this needs to be addressed during the next phase of training or rehabilitation. Then we need to determine how they achieved the performance, by looking at metrics such as time to take-off, or the duration of the unweighting, braking and propulsion phases of the CMJ, to get an indication of whether their movement strategy has changed. During rehabilitation, it is common that the phase durations increase as the athlete moves more cautiously, and this can even change within a training/rehabilitation session. Such differences in strategy can also be observed in the drop jump, with an increase in ground contact time, to provide greater time for both deceleration and acceleration, resulting in greater joint flexion and a reduction in net mean force production.
In both performance and rehabilitation scenarios, it is also worth comparing the athlete’s performance to that of comparable athletes presented in published research. However, as mentioned above, it is essential to identify if the data has been collected and analysed in a comparable manner. Such data may provide suitable goals to try and achieve with the athlete, although in this scenario, it is advisable to initially compare the athlete to the published means, but to set targets at one or two standard deviations above the mean, as no athlete wants to be average.
Summary
Standardisation of testing processes and data analysis procedures is essential, to ensure that data are comparable across time-points. It is also essential to ensure that when comparing an individual’s data to published data that the testing and data analysis procedures are comparable. Furthermore, a good basic grasp of the underpinning biomechanics of jumping notably helps in terms of interpretation of the resulting metrics and decision making for future training or rehabilitation. If considering ratio metrics, the component parts of the ratio are arguably more insightful than the ratio and should not be overlooked.
References
- Merrigan JJ, Stone JD, Galster SM, Hagen JA. Analyzing force-time curves: comparison of commercially available automated software and custom MATLAB analyses. J Strength Cond Res. 2022;36(9):2387-2402. doi: 10.1519/JSC.0000000000004275. PMID: 35916879. ↩1 ↩2 ↩3 ↩4 ↩5
- Merrigan JJ, Strang A, Eckerle J, Mackowski N, Hierholzer K, Ray NT, et al. Countermovement jump force-time curve analyses: reliability and comparability across force plate systems. J Strength Cond Res. 2024;38(1):30-37. doi: 10.1519/JSC.0000000000004586. PMID: 37815253. ↩1 ↩2 ↩3 ↩4 ↩5
- Street G, McMillan S, Board W, Rasmussen M, Heneghan JM. Sources of error in determining countermovement jump height with the impulse method. J Appl Biomech. 2001;17(1):43-54. doi: 10.1123/jab.17.1.43. ↩1 ↩2
- Cefai CM, Shaw JW, Cushion EJ, Cleather DJ. An arm swing enhances the proximal-to-distal delay in joint extension during a countermovement jump. Sci Rep. 2024;14(1):20371. doi: 10.1038/s41598-024-70194-z. PMID: 39223150. ↩
- Hara M, Shibayama A, Takeshita D, Fukashiro S. The effect of arm swing on lower extremities in vertical jumping. J Biomech. 2006;39(13):2503-11. doi: 10.1016/j.jbiomech.2005.07.030. PMID: 16168998. ↩
- Owen NJ, Watkins J, Kilduff LP, Bevan HR, Bennett MA. Development of a criterion method to determine peak mechanical power output in a countermovement jump. J Strength Cond Res. 2014;28(6):1552-8. doi: 10.1519/JSC.0000000000000311. PMID: 24276298. ↩
- McMahon JJ, Suchomel TJ, Lake JP, Comfort P. Understanding the key phases of the countermovement jump force-time curve. Strength Cond J. 2018;40(4):96-106. doi: 10.1519/SSC.0000000000000375. ↩1 ↩2 ↩3 ↩4 ↩5
- Hahn D. On the phase definitions of counter movement jumps. Scand J Med Sci Sports. 2023;33(3):359-360. doi: 10.1111/sms.14288. PMID: 36775878. ↩
- McBride JM, Kirby TJ, Haines TL, Skinner J. Relationship between relative net vertical impulse and jump height in jump squats performed to various squat depths and with various loads. Int J Sports Physiol Perform. 2010;5(4):484-96. doi: 10.1123/ijspp.5.4.484. PMID: 21266733. ↩
- Linthorne NP. Analysis of standing vertical jumps using a force platform. Am J Phys. 2001;69(11):1198-1204. doi: 10.1119/1.1397460. ↩
- Linthorne NP. The correlation between jump height and mechanical power in a countermovement jump is artificially inflated. Sports Biomech. 2021;20(1):3-21. doi: 10.1080/14763141.2020.1721737. PMID: 32200754. ↩
- Spencer R, Sindall P, Hammond KM, Atkins SJ, Quinn M, McMahon JJ. Changes in body mass and movement strategy maintain jump height immediately after soccer match. Appl Sci. 2023;13(12):7188. doi: 10.3390/app13127188. ↩
- Cormie P, McBride JM, McCaulley GO. Power-time, force-time, and velocity-time curve analysis of the countermovement jump: impact of training. J Strength Cond Res. 2009;23(1):177-86. doi: 10.1519/JSC.0b013e3181889324. PMID: 19077740. ↩
- Cormie P, McGuigan MR, Newton RU. Influence of strength on magnitude and mechanisms of adaptation to power training. Med Sci Sports Exerc. 2010;42(8):1566-81. doi: 10.1249/MSS.0b013e3181cf818d. PMID: 20639724. ↩
- Cormie P, McGuigan MR, Newton RU. Adaptations in athletic performance after ballistic power versus strength training. Med Sci Sports Exerc. 2010;42(8):1582-98. doi: 10.1249/MSS.0b013e3181d2013a. PMID: 20139780. ↩
- Cormie P, McGuigan MR, Newton RU. Changes in the eccentric phase contribute to improved stretch-shorten cycle performance after training. Med Sci Sports Exerc. 2010;42(9):1731-44. doi: 10.1249/MSS.0b013e3181d392e8. PMID: 20142784. ↩
- Costley L, Wallace E, Johnston M, Kennedy R. Reliability of bounce drop jump parameters within elite male rugby players. J Sports Med Phys Fitness. 2018;58(10):1390-1397. doi: 10.23736/S0022-4707.17.07400-X. PMID: 28745469. ↩1 ↩2
- Geraldo GDF, Bredt SDGT, Menzel HJK, Cançado GHDCP, Carvalho LACM, Lima FV, et al. Drop height is influenced by box height but not by individual stature during drop jumps. J Phys Educ. 2019;30:e3078. ↩1 ↩2
- McMahon JJ, Lake JP, Stratford C, Comfort P. A proposed method for evaluating drop jump performance with one force platform. Biomechanics. 2021;1(2):178-189. doi: 10.3390/biomechanics1020015. ↩1 ↩2 ↩3
- Bobbert MF, Huijing PA, van Ingen Schenau GJ. Drop jumping. II. The influence of dropping height on the biomechanics of drop jumping. Med Sci Sports Exerc. 1987;19(4):339-46. PMID: 3657482. ↩1 ↩2
- Ladlow P, Ripley NJ, Cabarkapa DV, Cabarkapa D, Chapman DW, Geneau MC, et al. Selecting force plate tests and metrics to complement physical preparation strategies prior to commencing strenuous military training courses. Front Sports Act Living. 2026;8:1891717. doi: 10.3389/fspor.2026.1891717. PMID: 42719048. ↩
- Bishop C, Read P, Chavda S, Turner A. Asymmetries of the lower limb: the calculation conundrum in strength training and conditioning. Strength Cond J. 2016;38(6):27-32. doi: 10.1519/SSC.0000000000000264. ↩1 ↩2
- Maestroni L, Turner A, Read P, Bettariga F, Fenu G, Rosalia A, et al. Interlimb asymmetry data in athletes with anterior cruciate ligament reconstruction: a comparison of different equations to interpret between-limb difference data. J Strength Cond Res. 2026;40(2):158-166. doi: 10.1519/JSC.0000000000005280. PMID: 41359911. ↩
- McClean ZJ, Mossel NB, McKenzie M, Aagaard P, Herzog W, Pasanen K, et al. Lower extremity asymmetry values derived from multiple strength testing modes are associated with perceived functional capabilities among university athletes. Transl Sports Med. 2024;2024:5589056. doi: 10.1155/2024/5589056. PMID: 39478757. ↩
- Lake JP, Mundy PD, Comfort P, Suchomel TJ. Do the peak and mean force methods of assessing vertical jump force asymmetry agree?. Sports Biomech. 2020;19(2):227-234. doi: 10.1080/14763141.2018.1465116. PMID: 29782223. ↩